Kristína Bachová

Power BI Specialist — making BI work, properly.

I help companies turn messy BI into trusted, scalable reporting.

Book a free discovery call

Industries I've worked across:

Logistics Healthcare Consultancy IT

What I do

BI Operations

Keep your Power BI environment healthy, monitored, and running smoothly. Gateway management, performance tuning, incident resolution.

CoE Setup & Governance

Build the structure, best practices, and training that make Power BI self-service actually work across your organisation.

Scalable Reporting

Design dashboards and data models that grow with your business — not ones you'll have to rebuild in six months.

Not sure which package fits? Start with a Health Check — it's the fastest way to find out.

Get in touch

How It Works

1

Discovery Call

A free 30-minute call. You explain the problem; I tell you honestly whether and how I can help.

2

Proposal & Scope

I put together a clear proposal: what's included, what's not, timeline, and price. No surprises.

3

Delivery

Hands-on work, regular check-ins, and a handover that actually makes sense.

Package Details

Health Check

Best for: Teams unsure where BI risks are Primary goal: Identify risks & priorities Timeframe: 1–2 weeks Price starts from: €800

A structured audit of your Power BI environment that surfaces risks, inefficiencies, and quick wins across security, performance, governance, data quality, and scalability.

What's included (base price):

  • Executive-ready BI assessment report
  • Risk scoring across 5 key areas (security, performance, governance, data quality, scalability)
  • Prioritised 30-day action roadmap

Optional add-ons:

  • Extended assessment covering shadow BI & Excel dependencies (+1 week)
  • Stakeholder interviews & workshop facilitation
  • Detailed capacity & licensing optimization analysis
Take the free assessment →

Fill in the questionnaire first — then book your free follow-up call.

Stabilisation

Best for: Teams firefighting issues Primary goal: Fix what's broken, fast Timeframe: Typically 4–8 weeks depending on scope Pricing: Pricing on request

Hands-on engagement to diagnose and resolve your most critical Power BI issues and leave you with a stable, documented environment. Every engagement starts with a triage review — what's broken, what's at risk, and what will have the most impact.

Depending on your situation, this can include:

  • Critical issue triage and root cause analysis
  • Report and dataset performance tuning
  • Broken relationships, measures, or data source fixes
  • Workspace structure and access review
  • Basic governance foundations (naming standards, folder structure, documentation)
  • Row-level security review or implementation
  • Gateway setup, monitoring, and alert configuration
  • User training on Power BI best practices
  • 60–90 day improvement roadmap with prioritised next steps

What's always included: A discovery session to understand your environment, a written proposal with clear scope before any work begins, and a handover document at the end.

CoE & Operating Model

Best for: Organisations scaling BI beyond a single team Primary goal: Build the structure, standards, and processes that make Power BI scale Timeframe: Typically 6–16 weeks depending on scope and organisational complexity Pricing: Pricing on request

A structured engagement to design and implement the governance layer your Power BI environment needs to grow sustainably. The right scope depends on your organisation's size, maturity, and how BI is currently used — this is always defined collaboratively after a discovery session.

Depending on your situation, this can include:

  • Current-state assessment of BI maturity, ownership, and pain points
  • CoE operating model design (roles, responsibilities, engagement model)
  • Governance framework and policy documentation
  • Workspace strategy and access structure design
  • Best-practice guidelines for data modelling, DAX, and report design
  • Dataset certification and endorsement process
  • Deployment pipeline setup (Dev / Test / Prod)
  • Automated monitoring and alerting configuration
  • Training programme design and delivery
  • Microsoft Fabric or Premium capacity migration planning
  • Strategic BI roadmap (6–12 months)
  • Executive presentation and stakeholder alignment session
  • Ongoing advisory support (monthly retainer, available as an add-on)

What's always included: A discovery session, a scoped proposal before work begins, all governance documentation in editable format, and a structured handover.

Fractional BI Ops

Best for: Ongoing BI leadership needs Primary goal: Prevent future problems Commitment: Minimum 3 months Price starts from: €1,200/month

Part-time BI operations leadership on a monthly retainer — keeping governance on track, fielding team questions, and ensuring your BI environment doesn't quietly drift into chaos.

What's included (base monthly retainer):

  • Continuous governance oversight (up to 10 hours/month)
  • Monthly health reviews & priority recommendations
  • Advisory support for team questions & blockers
  • Rolling roadmap updates

Optional add-ons:

  • Additional advisory hours beyond the base 10
  • Hands-on delivery work (dashboard fixes, model optimization)
  • Quarterly executive reporting
  • On-call support for critical issues

Frequently Asked Questions

Not necessarily. I'll assess your current licensing as part of any engagement and advise on what you actually need — not what a vendor wants to sell you.

A basic CoE framework can be in place in 6–8 weeks. Making it stick — training, adoption, governance — is an ongoing process, which is exactly what the Fractional BI Ops package supports.

Always from what you have. A Health Check or Stabilisation engagement starts by reviewing your current setup, not replacing it.

Yes. I work remotely with clients across Europe. Everything runs over video calls, shared screens, and collaborative tools — location is not a barrier.

Every engagement ends with clear documentation and a handover. If you want ongoing support, Fractional BI Ops is designed exactly for that.

Every engagement is scoped based on your specific situation — team size, number of reports, complexity, and timeline. During our discovery call, I'll give you a fixed-price proposal tailored to what you actually need.

Industry Template · Hotel

Hotel Industry BI Template for Opera PMS

A ready-to-use Power BI reporting template built around Oracle Opera PMS exports. Covers daily flash, reservations, market segments, package forecasting, and room statistics — all pre-modelled and styled for immediate deployment.

View template →
CoE & Governance

CoE Setup for a Global Medical Devices Company

Built a Power BI Centre of Excellence from scratch — governance framework, best-practice guidelines, training programme, and workspace structure. End result: business users could create their own reports confidently within guardrails.

Outcome: A structured governance foundation adopted by the BI team — clear standards that reduced ambiguity and enabled scalable self-service reporting.

View case study →
BI Ops & Troubleshooting

BI Operations Stabilisation for an IT Services Firm

Took over a chaotic Power BI environment — broken reports, performance issues, no governance. Triaged, fixed, and put a monitoring and support process in place.

Outcome: Report failures dropped by 80%. Team confidence restored.

Dashboard Development

Power BI Reporting for Port Inspections & Logistics

Designed and delivered end-to-end Power BI reports for port inspection KPIs, lab results, and certification tracking. Included RLS for regional access control and trained local superusers.

Outcome: Replaced fragmented Excel reporting with a single source of truth.

Technical Skills

Power BI

DAX Power Query (M) Data Modelling Star Schema RLS Conditional Formatting Calculation Groups Incremental Refresh

Platform & Governance

CoE Setup Tenant Administration Gateway Management Workspace Management Premium Capacity Planning

Integration & Automation

SQL Server Azure SharePoint PowerShell & REST API ServiceNow

Microsoft Fabric

Dataflows Fabric Capacity OneLake

I'm currently building new showcase dashboards using public datasets. Check back soon — or follow me on LinkedIn for updates.

Kristína Bachová

I've spent over 10 years in business intelligence — starting as a Power BI developer in logistics, moving through healthcare and consultancy, and eventually into BI operations and governance leadership. Along the way I've built dashboards that people actually use, set up centres of excellence that stuck, and fixed BI environments that were quietly falling apart.

I went on maternity leave in 2024 and used the time to think clearly about what kind of work I actually want to do. The answer was obvious: the CoE and governance side — the part where you help an entire organisation get better at using data, not just one team.

Now I freelance. It lets me work on the problems I find genuinely interesting, for clients who are ready to take their BI seriously, without the politics of a big corporate structure.

"Freelancing isn't a gap-filler. It's a deliberate choice. I take on fewer clients so I can do better work for each one — and I'm always available for the right project."

Languages

English (Fluent) Slovak (Native) Czech (Native) Portuguese (Learning)

Tech Stack

Power BI DAX Power Query SQL Server Azure SharePoint PowerShell ServiceNow Fabric JIRA Confluence
CoE

How to Set Up a Power BI Centre of Excellence — Step by Step

A practical guide to building a CoE that lasts — from getting executive buy-in to writing governance guidelines that people actually follow.

Read more →
Governance

Power BI vs Microsoft Fabric — What Actually Changed?

Dataflows, capacity, OneLake — here's what's real, what's hype, and what it means for your Power BI setup right now.

Read more →
DAX

5 DAX Functions Every BI Team Should Know (And Why)

Beyond SUM and COUNT. The functions that actually make your measures efficient, maintainable, and readable.

Read more →
Governance

Writing Power BI Best Practices That People Will Actually Follow

Guidelines only work if they're clear, relevant, and not buried in a SharePoint folder nobody visits.

Read more →
Power BI

Power BI DAX Agent — Generate, Validate and Manage DAX Measures

A locally-running agent that generates validated DAX using your actual model schema, detects duplicates before you create them, and shows you the full impact of any change before you make it.

Read more →
Free Tool

Microsoft Fabric Tenant Settings

A live reference table of all 140+ Fabric tenant settings with default values, governance recommendations, and impact ratings. Updated automatically.

Read more →

When you activate Microsoft Fabric, your tenant comes pre-configured with over 140 settings. Some are switched on by default. Others are off. Most administrators never review them systematically — and that gap quietly creates real risk: data accessible to the wrong people, sensitivity labels not propagating, guest users invited without governance, Copilot sending data outside your EU boundary.

This tool gives you a clear, structured view of every tenant setting, what it does by default, what best practice looks like, and how much it matters if you leave it unchanged.

How to use it

Use the search and filters to focus on what matters most. Start with Requires Adjustment: Yes and Impact: High — that’s your priority list. You can also download the full table as a formatted Excel file to share internally or use in a governance review.

The table covers all current Microsoft Fabric tenant settings across every category — from information protection and export controls to Git integration, Copilot, and OneLake. Each row shows:

  • Default setting — what Microsoft configures out of the box
  • Recommended setting — what a well-governed tenant should have
  • Requires adjustment — whether the default needs to change
  • Impact — how much risk you carry by leaving the default in place (High / Medium / Low)

The table is updated automatically whenever Microsoft changes the documentation, so you’re always working from a current baseline.

Open the tool in a new tab →

What this isn’t

This is a reference and starting point, not a one-size-fits-all prescription. The right configuration for your organisation depends on your industry, compliance requirements, licensing tier, and how mature your BI governance is. A manufacturing company with a single internal team has different needs from a healthcare group with external data sharing in scope.

Need a full tenant review?

If you’d like a structured assessment of your Fabric environment — not just settings, but data model governance, access controls, workspace structure, and operational health — that’s exactly what a BI Health Check covers. Get in touch and we can talk through what’s relevant for your organisation.

Settings data is sourced from Microsoft Fabric documentation and updated automatically when Microsoft releases changes.

If you work with Microsoft Power BI, you've almost certainly heard this question over the past year:

"Do we still use Power BI, or are we supposed to move to Microsoft Fabric now?"

The short answer is straightforward: Power BI didn't go away. Fabric didn't replace it. But the context Power BI operates in has changed — and that matters for architecture, governance, and capacity planning.

This article breaks down what actually changed, what's mostly marketing, and how Power BI professionals should think about Fabric in practice today.

Power BI vs Fabric: The Correct Mental Model

Before Fabric, Microsoft analytics was a collection of loosely connected services:

  • Power BI
  • Azure Data Factory
  • Synapse
  • Dataflows
  • Separate storage layers

Fabric's goal is consolidation:

  • One platform
  • One storage layer
  • One capacity model

Power BI is now one workload inside Fabric, not a separate product line.

Think of Fabric as the house, and Power BI as one very important room inside it. Power BI remains the primary interface for business users — and the primary place where business logic is enforced.

What Actually Changed (And Matters)

1. OneLake Is Real — and It's the Biggest Shift

Fabric introduces OneLake, a single, tenant-wide data lake shared across Fabric workloads.

Why this matters in practice:

  • Data no longer has to be copied between tools
  • Multiple teams can access the same underlying data
  • Storage and compute are more clearly separated

Best-practice implications for Power BI:

  • Treat OneLake as a centralized data foundation, not a dumping ground
  • Keep transformation ownership clear (engineering vs BI)
  • Use Power BI semantic models to consume and shape data, not to store it redundantly

This reinforces a long-standing Power BI principle: centralize data, standardize logic, decentralize reporting.

Reality check: OneLake does not magically solve governance, data quality, or ownership. Without discipline, it can just as easily become a larger — and more expensive — data swamp.

2. Dataflows Didn't Disappear — They Evolved (Carefully)

Power BI Dataflows still exist. Fabric adds Dataflows Gen2, which:

  • Write directly to OneLake
  • Can be reused by non–Power BI workloads
  • Still use Power Query under the hood

What didn't change:

  • They're best suited for light to moderate transformations
  • They're not a replacement for full-scale data engineering pipelines
  • They require careful performance and dependency management

Practical guidance:

  • Use Dataflows for reusable, business-owned transformations
  • Avoid pushing heavy joins, large-scale fact processing, or complex orchestration into them
  • Keep Gen1 dataflows if they're stable and meeting business needs
Important: If your Gen1 dataflows are working well, there is no immediate business value in migrating just because Gen2 exists. Migration should be driven by reuse needs, not platform anxiety.

3. Capacity: Unified, but Less Forgiving

Fabric introduces unified capacity (F-SKUs) that power:

  • Power BI
  • Data Engineering
  • Data Warehousing
  • Real-Time Analytics

This replaces multiple disconnected pricing and capacity models.

What's better:

  • One shared pool of compute
  • Easier architectural alignment across teams
  • Fewer platform silos

What's harder in reality:

  • Power BI Pro licenses are still required for authors
  • BI workloads now compete with engineering workloads
  • Poorly designed pipelines can directly impact report performance
  • Cost attribution across workloads is still evolving
Senior-level reminder: Capacity does not fix bad Power BI models. Inefficient DAX still hurts. Overloaded visuals still hurt. Poor refresh strategies still hurt. Fabric amplifies good Power BI design — and exposes weak design faster.

When Fabric Capacity Makes Sense (And When It Doesn't)

Fabric capacity is a strong fit when:

  • Multiple teams share the same data platform
  • BI, engineering, and analytics workloads coexist
  • You already struggle with Premium constraints
  • Centralized governance is a priority

Traditional Power BI Premium still makes sense when:

  • Power BI is the primary or only workload
  • Fabric engineering features are out of scope
  • Cost predictability matters more than flexibility
  • The BI team owns most of the data lifecycle

Fabric is not mandatory — it's optional architecture.

What's Mostly Hype (For Now)

"You Must Move Everything to Fabric"

Not true.

  • Existing Power BI workspaces continue to work
  • Premium capacities still exist
  • Microsoft supports gradual, selective adoption

There is no requirement to redesign a functioning Power BI estate just because Fabric exists.

"Power BI Is Just a Front-End Now"

Also not true.

Power BI semantic models still:

  • Define business metrics
  • Enforce governance and security
  • Control performance at query time

Fabric adds upstream options — it does not replace the semantic layer. Business logic still belongs closest to consumption.

Fabric Readiness: An Honest Reality Check

Fabric is directionally strong, but not frictionless:

  • Monitoring across workloads is still fragmented
  • CI/CD for Fabric assets is evolving
  • Cost visibility at workload level can be unclear
  • Many organizations lack the engineering maturity Fabric assumes

For some teams, Fabric will feel empowering. For others, it will introduce operational complexity. Both outcomes are valid.

What This Means for Your Power BI Setup Today

If you already follow Power BI best practices, you're not behind.

Keep Doing:

  • Star schema modeling
  • Thin reports over shared semantic models
  • Certified datasets
  • Clear Dev/Test/Prod separation

Start Evaluating:

  • Centralized data in OneLake
  • Dataflows Gen2 where reuse is required
  • Capacity planning that accounts for non-BI workloads

Avoid:

  • Rebuilding solutions "because Fabric"
  • Mixing heavy ETL logic into Power BI models
  • Assuming capacity will compensate for poor design

The Bottom Line

Power BI wasn't replaced — it was repositioned.

Fabric is:

  • An architectural unification
  • A platform-level shift
  • A stress test for existing BI practices

For Power BI professionals, the message is simple: Fabric is not a reason to redesign your Power BI estate. It's a reason to validate whether your existing design was sound to begin with.

If your foundation is solid, Fabric isn't something you need to rush into. It's something you can adopt — deliberately, incrementally, and on your terms.

A Power BI Centre of Excellence (CoE) is not a reporting factory, and it's not a governance police force. At its best, it's a small, focused capability that enables scale: trusted data, consistent standards, and empowered report creators.

This guide outlines a pragmatic, experience-based approach to building a Power BI CoE that works in real organisations — aligned with Microsoft Power BI best practices, without unnecessary theory.

Step 1: Define the Purpose and Operating Model

Before defining tools, roles, or standards, be clear about why the CoE exists.

Most successful Power BI CoEs focus on:

  • Improving trust in data and metrics
  • Reducing duplication and rework
  • Enabling self-service analytics safely
  • Allowing Power BI usage to scale without chaos

Just as important is clarity on what the CoE is not:

  • Not the only team allowed to build reports
  • Not a mandatory gate for every dashboard

Define how the CoE engages

Many CoEs struggle because their engagement model is never explicit. Decide early:

  • When the CoE advises vs approves vs owns assets
  • Whether shared datasets are owned centrally or by domains
  • How decisions are escalated when standards are challenged
In practice: Most mature environments land on a federated model: domain teams own their data products, while the CoE owns standards, certification, and cross-domain alignment.

If you can't describe the CoE's purpose and operating model in two sentences, it isn't ready to launch.

Step 2: Secure Executive Sponsorship (With the Right Framing)

Active executive sponsorship is a strong predictor of CoE success. Without it, standards quickly become optional.

What typically resonates with leaders:

  • Reduced risk (data security, compliance, auditability)
  • Faster, more confident decision-making
  • Lower long-term cost through reuse and standardisation

What rarely resonates:

  • Dataset design patterns
  • Workspace naming conventions

Be explicit about what you're asking for:

  • Visible sponsorship, not just initial approval
  • Clear decision rights for standards and exceptions
  • Time allocation for CoE members
In practice: CoEs without sustained executive backing rarely survive beyond their initial rollout.

Step 3: Start Small With the Right Roles (Not a Big Team)

You don't need a large team to start a CoE. Most effective CoEs begin with 3–6 people, often part-time, covering these roles:

  • CoE Lead / Product Owner — prioritisation, stakeholder alignment
  • Power BI Architect — semantic models, performance, scalability
  • Platform or Tenant Admin — tenant settings, security, deployments
  • Enablement Lead — training, documentation, community building

These are roles, not job titles. Over-staffing early often leads to over-engineering. Scale the team only once demand is proven.

Step 4: Establish Governance People Will Actually Follow

Governance fails when it's either too abstract or too restrictive. Anchor it in everyday Power BI work and make expectations clear.

Workspace strategy

Define a small number of workspace types with clear intent, for example:

  • Personal / Sandbox — experimentation and learning
  • Team / Department — collaborative delivery
  • Certified / Endorsed — trusted, reusable content

Tie permissions, review expectations, and support levels to each type.

Dataset and model standards

Keep standards practical and enforceable:

  • Clear naming conventions for measures
  • Required descriptions for shared or certified models
  • Performance expectations for reusable datasets
In practice: The CoE should not own every semantic model. Domain teams own their datasets; the CoE defines standards and certifies models that are safe for reuse.

A simple certification checklist often works better than long documentation. For example:

  • Refresh succeeds consistently
  • Measures are documented
  • Query performance meets agreed thresholds
  • Security has been reviewed
  • A named business owner exists

Change and release management

Not every change requires heavy process:

  • Use Dev/Test/Prod for shared datasets
  • Apply lightweight peer review for certified assets
  • Define rollback expectations

Equally important is change communication. Define how breaking changes are announced, how long deprecations last, and where consumers can see what changed. Technical controls alone don't protect trust.

Step 5: Configure the Power BI Tenant Intentionally

The Power BI Admin Portal is where governance becomes enforceable.

Align tenant settings with your organisation's maturity:

  • Be cautious with external sharing and publish-to-web early
  • Control who can use premium features and create shared assets
  • Enable audit logs and usage metrics from day one
In practice: Hard restrictions can backfire. Blocking workspace creation or exports often leads to shadow IT. Where restrictions create friction, prefer guardrails, monitoring, and education over blanket bans.

Always document why each tenant setting exists. This prevents policy drift and helps future admins make informed changes.

Step 6: Enable Self-Service Instead of Fighting It

Self-service analytics will happen whether you plan for it or not. The CoE's role is to make the right way the easy way.

Effective enablement typically includes:

  • Shared, well-designed semantic models
  • Report templates with branding and layout guidance
  • Short, task-focused training sessions

Community scales better than ticket queues. Internal user groups, office hours, Teams channels, and showcase sessions often deliver more value than formal support processes.

Step 7: Measure, Prove Value, and Evolve

A CoE should be treated as a product, not a one-time project.

Track platform metrics such as:

  • Active users and creators
  • Reuse of shared and certified datasets
  • Support requests and performance issues

Over time, link these to business outcomes:

  • Fewer duplicate reports
  • Faster delivery of new insights
  • Reduced dependency on central teams for ad-hoc requests

As maturity increases, successful CoEs typically loosen controls, shifting from enforcement to enablement.

Common CoE Failure Modes

  • Lack of clear ownership — No one knows who owns shared datasets, standards, or decisions, leading to slow progress and conflict.
  • Over-governance too early — Heavy approval processes and restrictive tenant settings drive users to work around the platform.
  • CoE as a delivery factory — The CoE becomes the default report-building team, creating bottlenecks and burnout.
  • Ignoring change management — Breaking changes land without warning, eroding trust in shared datasets.
  • No success metrics — Without measurable outcomes, the CoE is eventually seen as overhead rather than value.

Final Thought

The most durable Power BI Centres of Excellence succeed because people want to follow the standards — not because they're forced to.

Start small, stay pragmatic, and optimise for trust over control. Perfect governance is rarely achievable; consistent, trusted insight at scale is.

If you've worked with Microsoft Power BI long enough, you know this pattern well: the model starts clean, measures are simple — and six months later, no one wants to open the measure pane.

This usually isn't because the business logic is hard. It's because the wrong DAX patterns were allowed to spread.

The five functions below aren't advanced tricks. They are foundational tools that, when used consistently, keep models understandable, performant, and safe for teams to evolve over time.

1. CALCULATE — The Engine Behind Context

CALCULATE is the most important function in DAX because it changes filter context. Almost every meaningful business measure relies on it, directly or indirectly.

Why it matters

  • Enables time intelligence and conditional logic
  • Allows measures to define their own business rules
  • Keeps logic centralized instead of scattered across visuals

Example

Sales – Online :=
CALCULATE (
    [Total Sales],
    'Sales'[Channel] = "Online"
)

This measure is explicit: the logic lives in DAX, not in report-level filters.

Practical reality: CALCULATE is powerful — and it's also where many models quietly break. Each filter argument replaces existing filters unless explicitly preserved. BI teams should treat CALCULATE logic as part of the semantic contract of the model, not as a quick fix.

2. VAR — Readability First, Performance Second

VAR lets you store intermediate results inside a measure and reuse them cleanly.

Why it matters

  • Makes measures easier to read and review
  • Simplifies debugging and testing
  • Can improve performance by avoiding repeated evaluation

Example

Profit Margin :=
VAR Revenue = [Total Sales]
VAR Cost = [Total Cost]
RETURN
DIVIDE ( Revenue - Cost, Revenue )

This pattern is easier to reason about than a single dense expression — especially in team environments.

Best practice: VAR always improves maintainability. Performance benefits depend on whether the expression would otherwise be re-evaluated — don't assume magic, but always prefer clarity.

3. DIVIDE — Defensive DAX That Behaves Well in Reports

Division errors are a common cause of broken visuals and confused users. DIVIDE handles divide-by-zero scenarios safely and intentionally.

Why it matters

  • Prevents errors without verbose logic
  • Returns BLANK() by default, which behaves better in visuals
  • Keeps measures concise and readable

Example

Profit Margin :=
DIVIDE ( [Profit], [Total Sales] )

BLANK() values suppress misleading percentages in matrices and charts, instead of showing zeros that imply meaning.

Best practice: Always use DIVIDE instead of / in measures intended for reporting.

4. SELECTEDVALUE — Safe Context Awareness

Interactive reports require measures to react to user selections. SELECTEDVALUE retrieves a single value only when exactly one exists, otherwise returning a defined fallback.

Why it matters

  • Cleaner than VALUES + HASONEVALUE
  • Prevents ambiguous or broken results
  • Ideal for slicer-driven logic and dynamic labels

Example

Selected Year :=
SELECTEDVALUE ( 'Date'[Year], "Multiple Years" )
Important guardrail: SELECTEDVALUE is best used for slicers and high-level context checks. Avoid using it in row-level calculations where the context is already singular — it adds unnecessary complexity and confusion.

5. ALL and REMOVEFILTERS — Intentional Control of Filters

Some calculations must ignore parts of the filter context — totals, benchmarks, or contribution percentages. That's where filter-removal functions belong.

Why it matters

  • Enables percent-of-total and share calculations
  • Supports baselines and comparisons
  • Keeps logic consistent across reports

Example

Total Sales (All Products) :=
CALCULATE (
    [Total Sales],
    REMOVEFILTERS ( 'Product' )
)
Team guidance: While ALL and REMOVEFILTERS often behave similarly, many teams prefer REMOVEFILTERS because it communicates intent more clearly and reduces the risk of unintended side effects in complex expressions.

What Not to Do (Common Team Pitfalls)

Avoid these patterns — they're responsible for most fragile models:

  • Embedding business logic in visuals instead of measures
  • Nesting multiple CALCULATE calls without documenting intent
  • Using / instead of DIVIDE in production measures
  • Overusing SELECTEDVALUE where row context already exists
  • Removing filters broadly (ALL(Table)) when only a column needs to be ignored
  • Writing clever one-line measures that no one else can maintain

If a measure needs explaining in a meeting, it probably needs refactoring.

Final Thought: DAX Is a Team Discipline

These functions don't make a model "advanced" on their own. What matters is how consistently they're applied.

Strong BI teams:

  • Centralize logic in measures
  • Prefer clarity over cleverness
  • Agree on filter-handling patterns
  • Write DAX that explains itself

When your measures are readable, predictable, and performant, you reduce defects, speed up onboarding, and turn your semantic model into something the business can actually rely on.

This article is about how to write Power BI best practices that professionals will actually follow — grounded in Microsoft Power BI guidance, but shaped by real-world delivery in enterprise and shared-reporting environments.

Note: These guidelines are primarily intended for shared datasets and reports that are reused, extended, or handed over between developers. Purely personal or exploratory reports may not require the same level of rigor.

Why Most Power BI Best Practices Fail

Most best practices don't fail because they're wrong. They fail because they're unusable.

Common problems include:

  • Rules that are too abstract ("Use good naming conventions")
  • Documents that are too long to reference while working
  • Generic guidance copied directly from documentation
  • Assumptions of ideal, greenfield projects that don't exist in reality

Power BI professionals work under time pressure, with evolving requirements and imperfect data. If a rule doesn't help them make a decision while building, it gets ignored.

Effective best practices are:

  • Specific
  • Actionable
  • Easy to check in under a minute

Start From How Power BI Is Actually Used

Microsoft's Power BI guidance assumes a few realities that are worth embracing:

  • Models grow over time
  • Multiple developers touch the same dataset
  • Performance problems often appear after adoption
  • Business users rarely read documentation

Best practices should be written for living models, not theoretical ones. That means accounting for refactoring, handovers, and long-term support — not just first delivery.

Key insight: When guidance reflects real usage patterns, it feels helpful instead of academic.

Structure Best Practices Around Real Decisions

Developers don't think in categories like Modeling or Visualization. They think in questions:

  • "Should this be a calculated column or a measure?"
  • "Do I need a new table, or can I reuse an existing one?"
  • "Is this DAX readable enough for someone else to maintain?"

Best practices should be structured to answer those questions directly.

Avoid this

Keep DAX simple.

Prefer this

If a measure contains multiple business rules, use variables and helper measures to improve readability, testing, and long-term maintenance.

The intent is the same — but the second version is something a developer can act on immediately.

Focus on the 20% That Causes 80% of Problems

Microsoft documentation is comprehensive. Your internal best practices shouldn't be.

Prioritize guidance that consistently causes issues in real projects:

  • Poor data modeling
  • Hard-to-maintain DAX
  • Inconsistent naming and formatting
  • Performance degradation at scale
  • Loss of trust in reported numbers

For most Power BI teams, that usually means emphasizing:

  • Star schema modeling
  • Measure-driven calculations
  • Avoiding unnecessary calculated columns
  • Consistent naming and formatting conventions
  • Careful use of bi-directional relationships
Practical reality: If a rule hasn't caused real pain in your environment, it probably doesn't belong in version 1.

Be Precise About Measures vs Calculated Columns

A common source of confusion is when to use calculated columns versus measures.

A practical guideline looks like this:

  • Prefer measures for aggregations and calculations evaluated at query time
  • Avoid calculated columns on large fact tables where possible, as they increase model size and refresh cost
  • Use calculated columns when values must be evaluated at refresh time, used in relationships, or exposed as slicers

This avoids dogma while aligning with how Power BI's engine actually works.

Make Performance Guidance Concrete — and Contextual

Performance advice is often ignored because it's vague or applied too early.

Instead of

Optimize your model for performance.

Be explicit and situational

  • Disable Auto Date/Time in shared or enterprise datasets
  • Reduce column cardinality where possible
  • Hide unused columns from the report view
  • Avoid bi-directional relationships unless there is a clear requirement
  • Validate performance using Performance Analyzer before publishing
Balance is key: Avoid premature optimization. Focus performance effort on datasets that are shared or heavily used. Optimize in response to real usage patterns, not theoretical concerns.

Treat Naming and Formatting as First-Class Practices

"Be consistent" isn't enough.

Good best practices provide examples, even if the exact standard varies by team.

For example:

  • Use business-friendly names with spaces (not underscores)
  • Avoid abbreviations unless they are widely understood by the business
  • Keep measure names free of table prefixes
  • Apply consistent number formatting at the model level

Clarity here improves usability, reduces confusion, and builds trust with report consumers.

Write for the Author, Not the Auditor

Best practices are rarely enforced by formal reviews. They're followed — or ignored — while someone is building a model.

That means they should be:

  • Skimmable
  • Short
  • Written in plain language
  • Easy to reference during development

If a developer can't quickly confirm a rule while writing DAX or modeling data, the rule won't be used.

Accept Constraints and Trade-Offs

Not every best practice can be applied in every situation.

Legacy data sources, organizational constraints, tight deadlines, and governance rules all force compromises. Good guidelines acknowledge this instead of pretending it doesn't happen.

The goal isn't theoretical perfection. It's consistency, transparency, and maintainability.

Keep Best Practices Alive

Power BI evolves constantly. So should your guidance.

To keep best practices relevant:

  • Review them periodically
  • Update them after major platform changes
  • Adjust them based on real incidents and lessons learned

And make them easy to find:

  • A short internal wiki page
  • A README alongside shared datasets
  • A pinned Teams or Slack post
Remember: If they're hidden, they don't exist.

The Real Goal

The purpose of Power BI best practices isn't to create flawless models.

It's to create predictable, understandable, and maintainable ones.

If your guidelines help someone make a better decision while building, they'll be followed.

If they can be checked quickly and explained easily, they'll last.

That's when best practices stop being rules — and start becoming shortcuts.

Book a free 30-min discovery call

Or send me a message

Please enter your name.
Please enter a valid email address.

📍 Based in Portugal · Available remotely across Europe

🕐 Typically respond within 24 hours on working days

Connect on LinkedIn

Three months ago I had never written a Python agent in my life. I knew DAX, data modelling, and governance — but agentic AI was completely new territory. I built this anyway, because I kept seeing a problem I wanted to solve. I’m calling it the Power BI DAX Agent, and I’ve made it free for anyone to use.

This article explains why I built it, who it is designed for, how it compares to other AI-powered approaches to Power BI development, and where it’s heading next.

Why I Built This

The problem I kept running into wasn’t with Power BI itself. It was with the context in which most companies use it.

In a mid-size company, there is usually one person who “does Power BI.” That person is not necessarily a dedicated BI developer. They are a finance manager who learned DAX from YouTube, or an ops analyst who built a dashboard that got promoted to the company’s main reporting tool, or an IT generalist who maintains a growing semantic model alongside everything else they do.

These people face a specific and under-discussed problem: they need to change things without breaking things.

They’re not looking for ways to build faster. They’re worried about what happens when they rename a column that fifteen measures depend on. They don’t know if the measure they’re about to create already exists under a slightly different name. They have no way of knowing the downstream impact of a change before they make it.

Existing AI tools for Power BI don’t really solve this problem. Most of them are designed to make senior developers faster — which is valuable, but it’s not the same thing.

So I built something designed around a different principle: confidence over speed. I built it with Claude Code, drawing on ideas from Kalina Ivanova and Kurt Buhler’s work in the Power BI agentic development space.

What the Agent Actually Does

The Power BI DAX Agent is a locally-running web application. You open it in your browser, point it at your Power BI model file, and describe the measure you need in plain English. The agent generates validated DAX using only your actual tables and columns, checks for duplicates, and asks for your approval before saving anything.

Here is the end-to-end flow:

1. Load your model with a sanitisation review

Before anything reaches the AI, the agent scans your model file and strips sensitive metadata — database connection strings, file paths, email addresses, SharePoint URLs, and similar content. You see exactly what was found and what was masked. Nothing proceeds until you explicitly approve the clean version. The idea for this gate came from Kalina Ivanova, who built a standalone PowerShell script to scrub sensitive metadata from TMDL files before sharing with AI tools. I took that concept and embedded it directly into the agent workflow. Kurt Buhler’s power-bi-agentic-development repository also shaped how I thought about safe agentic patterns for Power BI more broadly.

Model Sanitisation Review screen showing 105 sensitive items found and masked before loading

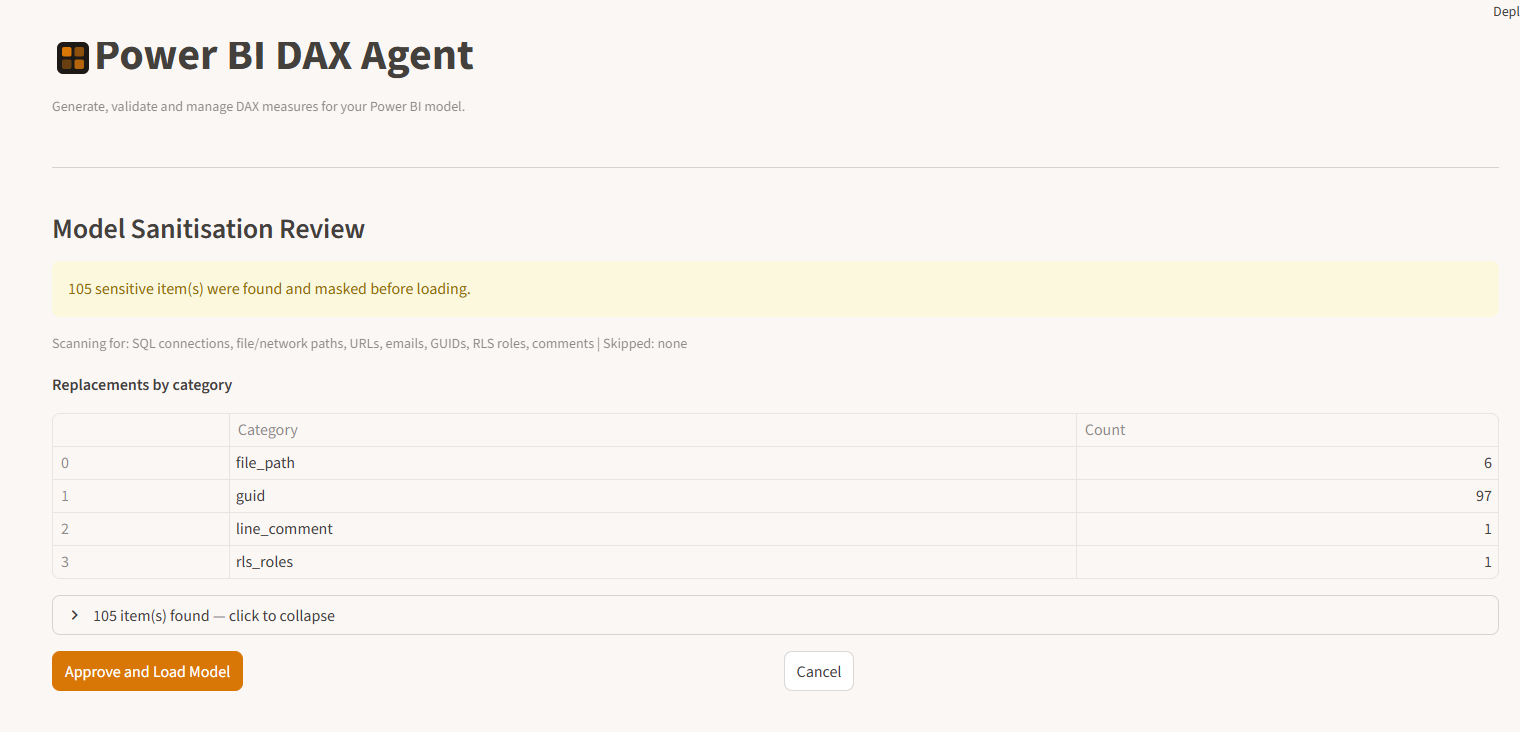
The sanitisation review screen — you see exactly what was found and masked before anything is loaded into the agent.

Expanded list of sanitised items showing masked connection strings and file paths

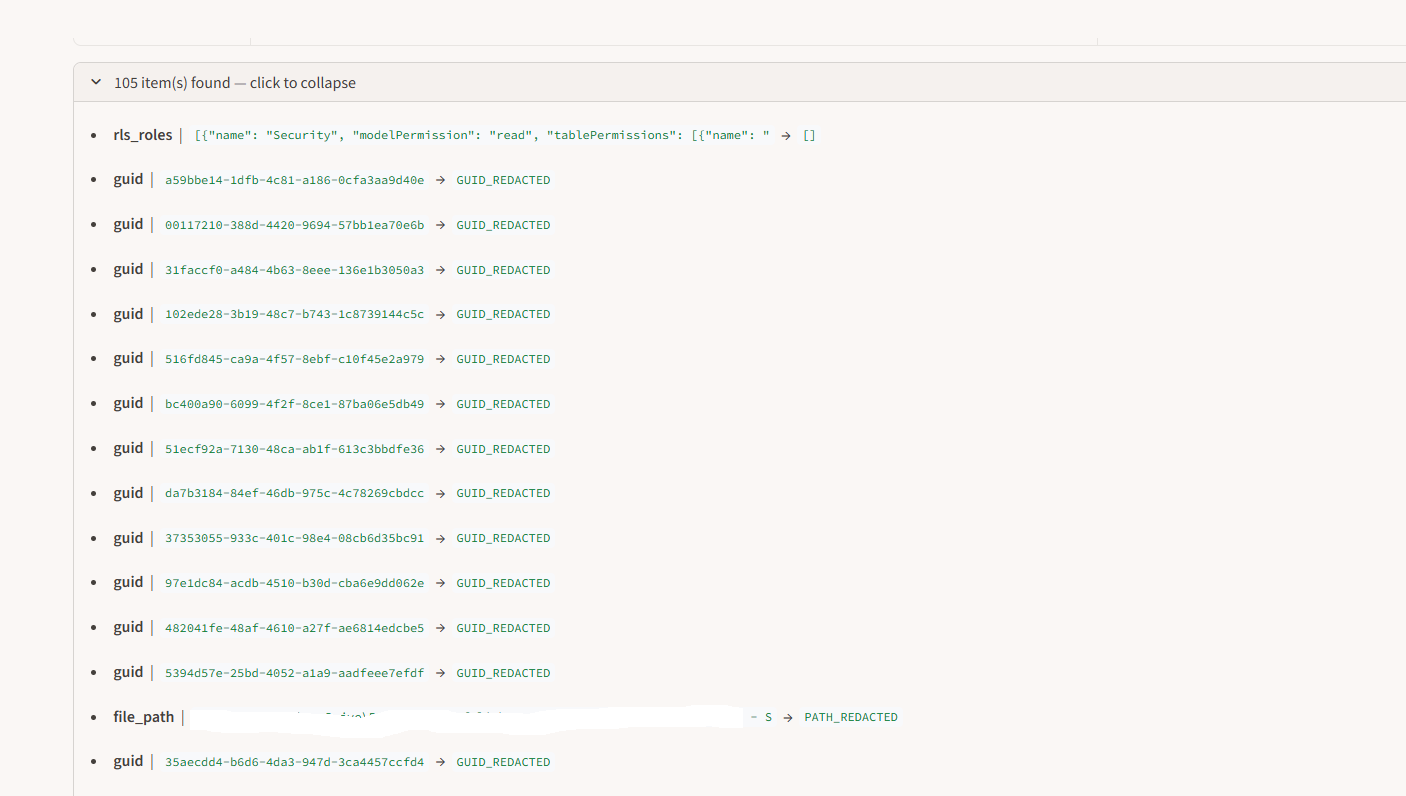
The expandable items list shows each masked value and what it was replaced with.

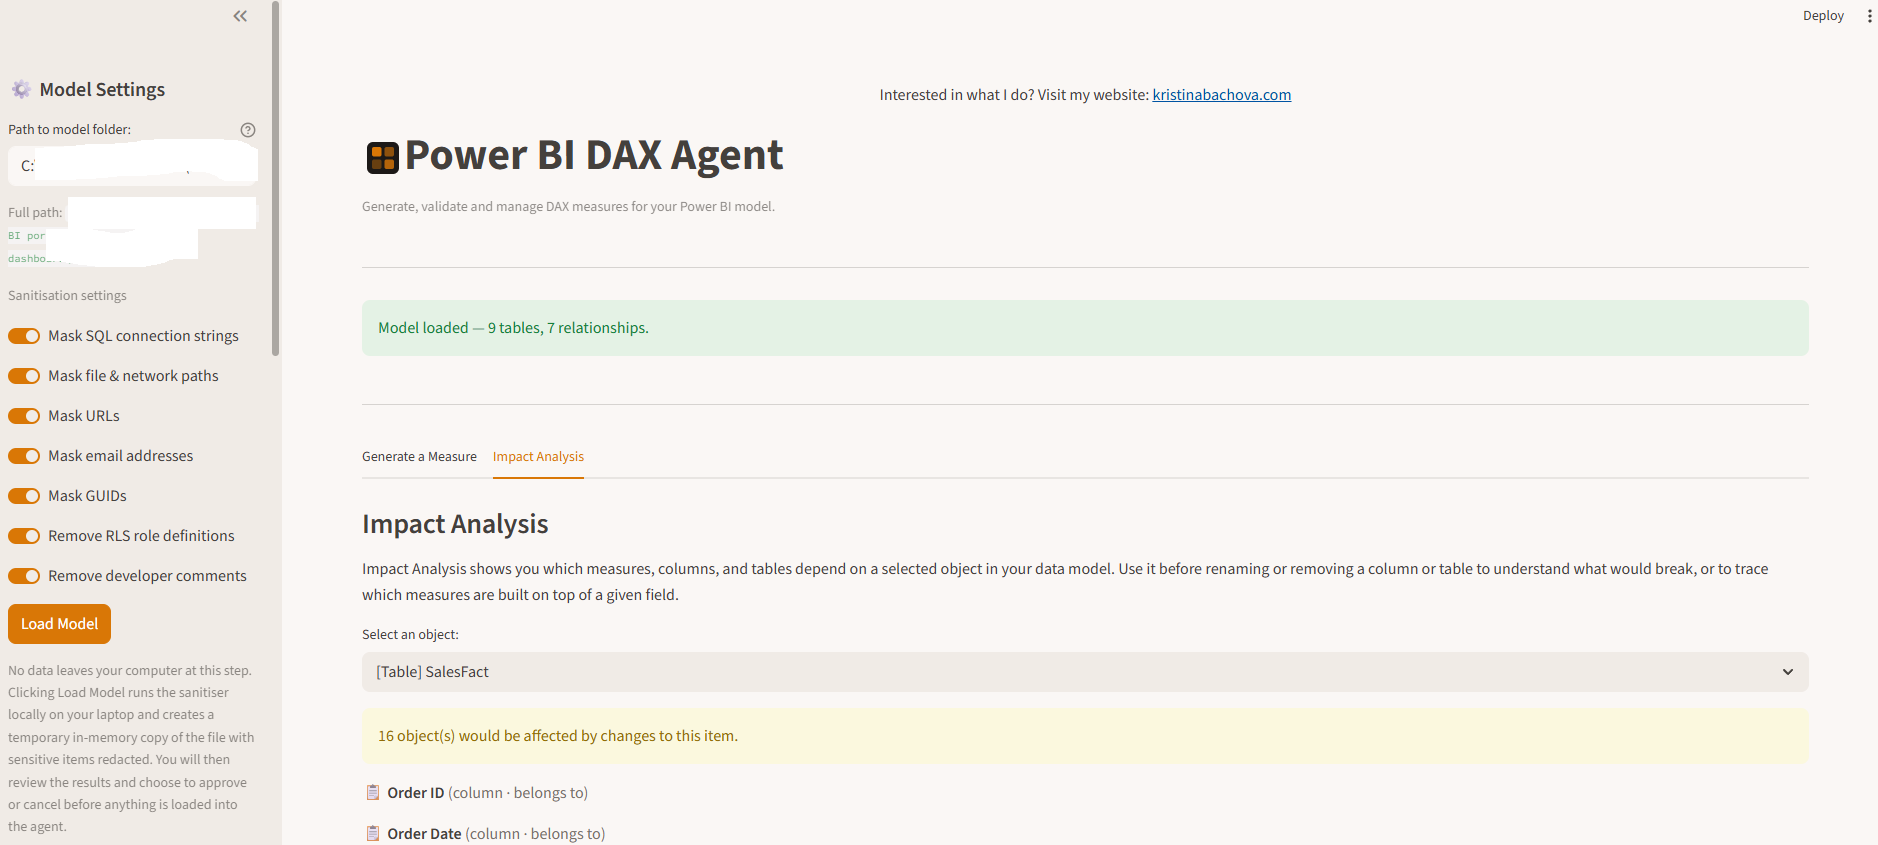
2. Explore your schema and understand dependencies

Once the model loads, a lineage graph is built automatically. You can select any table, column, or measure and see everything that depends on it. If you’re about to change a column, the agent tells you exactly which measures would be affected. You know the blast radius before you touch anything.

Impact Analysis tab showing dependent measures for a selected column

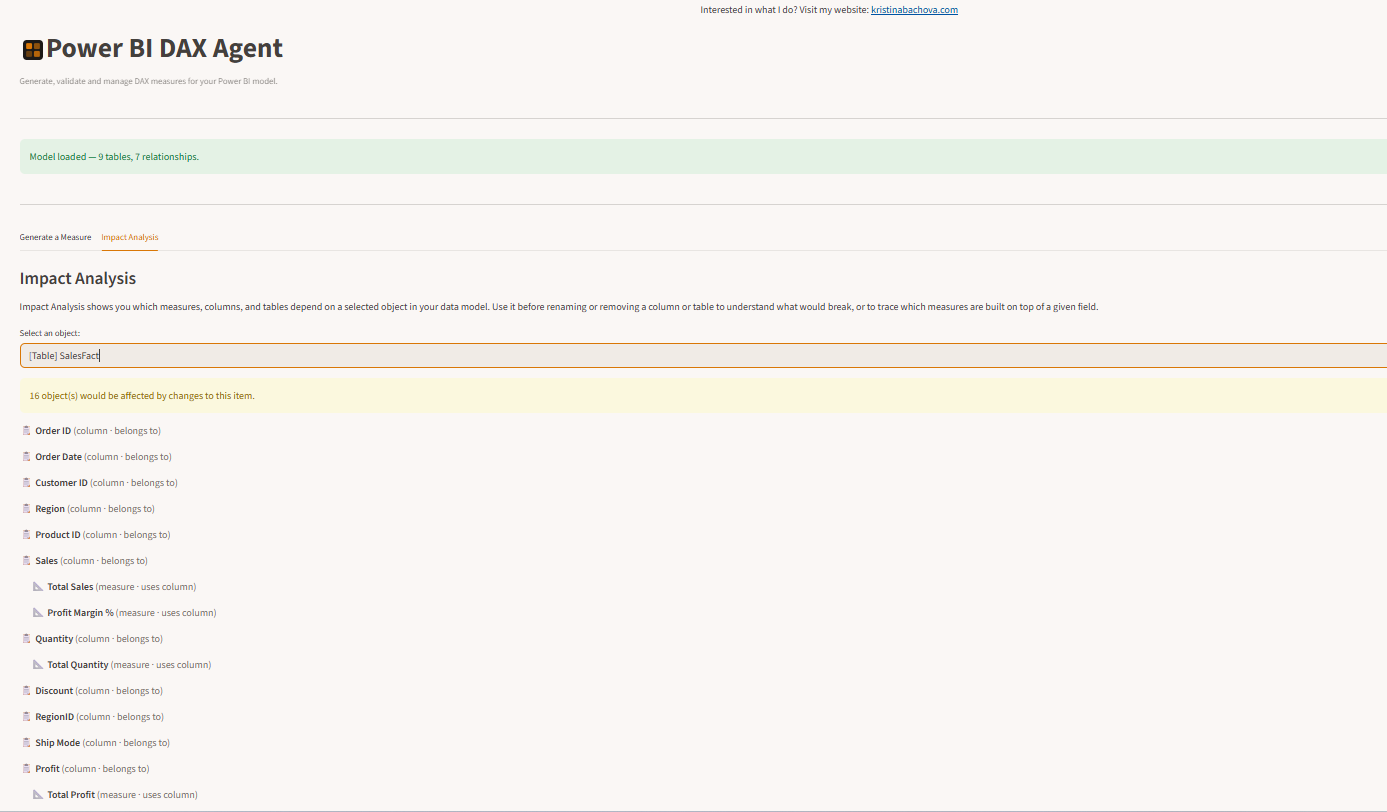
Impact Analysis — select any table, column, or measure to see everything that depends on it.

3. Generate DAX with a human approval gate

You describe what you need. The agent checks your measure library first — if a similar measure already exists, it surfaces it and asks if you want to use it instead. If nothing matches, it generates DAX, validates it structurally and semantically, and presents it for your review. You approve it or reject it. Only approved measures are saved.

Generate a Measure tab with the measure library visible on the right

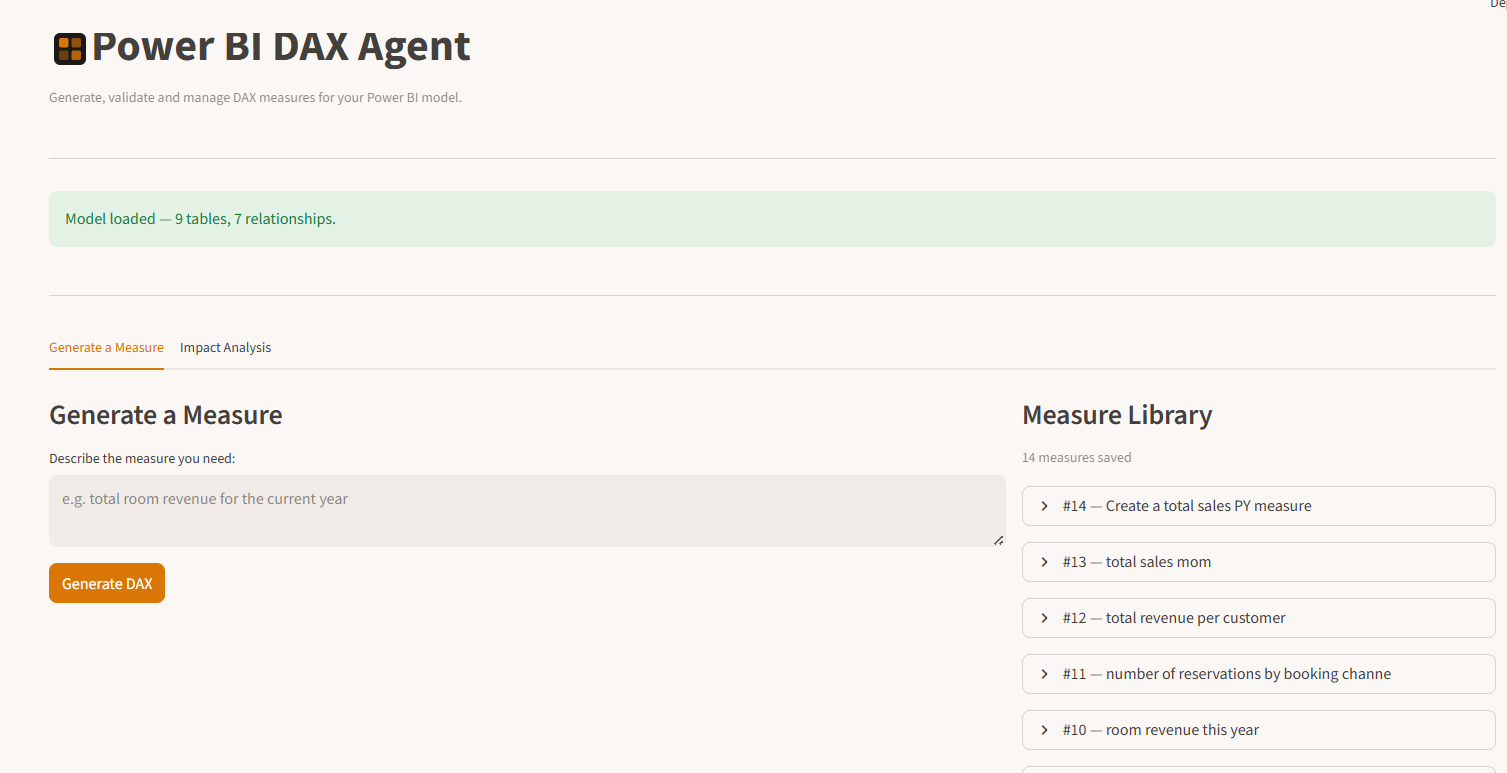
The Generate a Measure tab — describe what you need in plain English, review the output, and approve or reject it.

Full agent interface showing the sidebar with model settings and sanitisation options

The full interface — model settings and sanitisation options in the sidebar, the main workspace on the right.

4. Build an institutional measure library

Every approved measure is saved to a persistent library with the original request, the DAX, how many attempts it took to generate, and a timestamp. Over time this becomes a searchable record of every measure your team has generated, which also feeds back into the duplicate detection.

Who This Is For

The primary audience is anyone managing Power BI — particularly in EU markets where data governance and GDPR compliance are genuine daily concerns, not theoretical ones.

More specifically, it is designed for:

  • The solo BI person who owns the Power BI environment and needs a reliable assistant that works within guardrails, not around them
  • Freelance Power BI consultants who work across multiple client environments and want a consistent, governed workflow for measure development
  • Small BI teams where junior analysts are generating measures but a senior developer wants oversight before anything reaches the production model
  • Companies in regulated industries — healthcare, financial services, legal — where every change to a reporting environment needs to be traceable and auditable

That said, this is not limited to that audience. Any Power BI developer who values a governed workflow over an unconstrained one may find it useful — especially for client-facing or production environments where mistakes are expensive.

How This Compares to MCP + Copilot and VS Code + Copilot

This is the question I expect most from people who already use AI tools for Power BI development, so I want to address it directly.

Microsoft’s Power BI Modeling MCP Server

Microsoft recently released a Power BI Modeling MCP Server that lets AI assistants like GitHub Copilot or Claude talk directly to a running Power BI Desktop instance. You can ask it to create measures, rename tables, build relationships, and refactor your model through natural conversation in VS Code or Claude Code.

This is genuinely impressive technology and I use it myself for exploratory work. But it is designed for a developer workflow, and it makes some assumptions that are not safe in a business context:

  • It writes changes directly to your open model. There is an undo function, but there is no approval gate, no audit trail, and no blast radius analysis before a change is made.
  • It sends your full model schema to the AI — including connection strings, file paths, and RLS definitions — without a sanitisation step.
  • It requires Power BI Desktop to be open and running. It cannot work from a model file alone.
  • It has no persistent memory. Nothing is remembered between sessions. There is no measure library, no duplicate detection, no lineage graph.

For a senior developer working on their own environment who knows what they are doing: MCP is fast and powerful. For a business context where multiple people touch a model and changes need to be traceable: it is missing the safety layer.

VS Code + GitHub Copilot (without MCP)

This is the more general version of the developer assistant workflow — using Copilot in VS Code to help write DAX, Power Query M code, or TMDL. It is useful for developers who are already comfortable in a code editor and want AI assistance inline.

The same considerations apply. This is a tool that makes developers faster. It does not address governance, impact analysis, or the non-technical user.

Where the Power BI DAX Agent Sits

The DAX Agent is not trying to compete with MCP for the developer use case. It is solving a different problem for a different audience.

Power BI DAX Agent MCP + Copilot
Designed forBusiness context, governed workflowDeveloper productivity
User profileFinance manager, solo BI person, consultantSenior BI developer
Requires VS CodeNo — runs in a browserYes
Sanitisation gateBuilt inNot included
Human approval gateMandatoryNot included
Audit trailFull historySession only
Duplicate detectionBuilt inNot included
Lineage and impact analysisBuilt inNot included
Works without Power BI Desktop openYesNo
Persistent measure libraryYesNo
The honest summary: if you are a senior BI developer who lives in VS Code and knows exactly what you are doing, MCP is probably a better fit for your daily workflow. If you are managing Power BI in a business context where changes need to be safe, traceable, and understandable to non-technical stakeholders — this is built for you.

The Data Protection Question

One question I get asked immediately whenever AI and Power BI are mentioned together is: what data actually leaves my machine?

This is the right question to ask, and I want to answer it precisely.

When you load a model into the agent, the following happens on your machine only:

  • The raw model file is read from your local disk
  • The sanitisation scan runs locally — finding and masking connection strings, paths, emails, URLs, and any other sensitive metadata you have configured
  • You review the sanitisation report in your browser (which is running at localhost — your machine talking to itself)
  • You approve the clean version

The first and only time anything leaves your machine is when you type a measure request and click Generate. At that point, the sanitised schema (table names, column names, measure names, data types, relationships) and your plain English request are sent to the Anthropic API.

What never leaves your machine: actual data values, database connection strings, file paths, email addresses, RLS role definitions, and any other sensitive metadata the sanitiser has masked.

The agent runs locally. There is no cloud server receiving your files. If you are in a regulated industry or a GDPR-sensitive environment, the sanitisation gate is configurable — you can choose to also mask GUIDs and remove RLS definitions entirely before the model is reviewed.

What’s Still Being Built

This is a working prototype, not a finished product. I am sharing it now because real-world feedback is more valuable than months of building in isolation.

What is working today:

  • Model loading with sanitisation review and approval gate
  • DAX generation using your actual schema
  • Two-layer validation with automatic retry
  • Duplicate measure detection
  • Human approval gate before saving
  • Persistent measure library with search
  • Lineage graph with impact analysis
  • Model browser in the sidebar
  • Support for any model.bim file

What is still being built:

  • System A — a discovery and requirements agent that conducts a structured interview with business stakeholders and produces a semantic model design from scratch
  • System C — a full amendment protection layer with regression testing, so changes to existing measures can be validated against known-good baselines before deployment
  • Automatic deployment to Power BI via the REST API or XMLA endpoint
  • Hosted version for clients who cannot run a local install
  • Multi-user support with role-based access

Try It and Tell Me What’s Missing

The repository is public and free to use. You bring your own Anthropic API key — a month of typical usage costs a few euros.

View on GitHub →

Last updated: 26 February 2026

1. Who I am (Data Controller)

Kristína Bachová
Power BI Specialist
Based in Portugal
Contact: info@kristinabachova.com

I am the data controller for personal data collected through this website. As a sole trader, I take data protection seriously and process only what is necessary.

2. What personal data I collect

Contact form

When you use the contact form I collect: your name, email address, company name (optional), and your message. This data is processed by Formspree (a third-party form processor) and forwarded to my email inbox.

Newsletter sign-up

If you subscribe to my newsletter, I collect your email address (and optionally your name). This is processed by Kit (formerly ConvertKit), my email marketing platform.

Booking widget

If you book a discovery call via the Calendly booking widget, Calendly collects your name, email address, and scheduling preferences directly. I receive a copy of your booking details. See Calendly's Privacy Policy for details.

Cookies and usage data

The site uses cookies and similar local storage as described in Section 9 below. I do not currently use analytics tools that track your browsing behaviour.

Server logs

Like most websites, my hosting provider (GitHub Pages) may log your IP address and browser information in standard server access logs. I do not control or access these logs directly. See GitHub's Privacy Statement for details.

3. Why I collect it (Legal basis)

4. Who I share your data with

I do not sell your data. I share it only with the service providers listed below, who act as data processors on my behalf:

I may also be required to disclose data to law enforcement or regulatory authorities if required by law.

5. International data transfers

Formspree, Kit, and Calendly are US-based companies. When your data is transferred to the United States, these transfers are made under standard contractual clauses (SCCs) or other transfer mechanisms approved under the EU GDPR. Please refer to each provider's privacy policy for details.

6. How long I keep your data

  • Contact form enquiries: I keep email correspondence for up to 2 years after our last interaction, or until you ask me to delete it.
  • Newsletter subscribers: Your email is kept until you unsubscribe. I also periodically remove inactive subscribers.
  • Booking records: Calendly retains booking data in accordance with their policy.
  • Cookie preferences: Stored in your browser's localStorage until you clear it or change your preferences.

7. Your rights under GDPR

As a data subject in the EU/EEA, you have the following rights:

8. How to exercise your rights

To exercise any of the rights above, please contact me at: info@kristinabachova.com

I will respond within 30 days. There is no charge for making a request. If your request is complex or numerous, I may extend the response period by a further two months, and I will let you know.

To unsubscribe from my newsletter, use the unsubscribe link in any email I send, or contact me directly.

To change your cookie preferences on this website, use the Cookie Settings link in the footer of this page.

9. Cookies and similar technologies

This site uses cookies and browser localStorage. No non-essential cookies are set before you give consent.

You can manage your cookie preferences at any time using the Cookie Settings link in the footer. You can also clear cookies and localStorage through your browser settings.

10. Right to lodge a complaint

If you believe I have not handled your personal data correctly, you have the right to lodge a complaint with the Portuguese data protection supervisory authority:

CNPD — Comissão Nacional de Proteção de Dados
Website: www.cnpd.pt
Address: Rua de São Bento, 148–3º, 1200-821 Lisboa, Portugal

I would, however, appreciate the opportunity to address your concerns directly before you contact the supervisory authority. Please reach out to me first at info@kristinabachova.com.

11. Third-party links

This site may contain links to external websites (e.g. LinkedIn, GitHub). I am not responsible for the privacy practices of those sites. Please review their privacy policies directly.

12. Changes to this policy

I may update this policy from time to time. The date at the top of this page always reflects the most recent revision. For significant changes, I will update the date and, where appropriate, notify subscribers.

Questions? Email me at info@kristinabachova.com